More Charts on UnitedHealth Group's Eliminations Data
Read on for visuals showcasing how UnitedHealth Group is doing more and more business just with itself.
Today, we published an exciting new analysis with HEALTH CARE un-covered offering financial evidence that UnitedHealth Group is becoming more of a closed system over time. This means that its many subsidiaries are doing business just with each other, rather than other insurers, doctors, pharmacy benefit managers, software firms, and analytics providers that operate independently. Because UnitedHealth is the largest or a top provider of all these services, owning a significant and increasing share of each market, its growing internalization raises the possibility that it is unethically self-selecting, with ramifications for patients, small medical practices and healthcare businesses, and government payers, who might be cheated out of a fair deal.
We specifically look at UnitedHealth’s quarterly eliminations data from 2008 to 2023. This data, reported in the company’s SEC filings, represents the amount of money that its healthcare services division, Optum, makes from its insurance division, UnitedHealthcare. The company’s financial planners subtract this figure to arrive at the revenue they report to investors and regulators. Our analysis factors it back in and then calculates what portion of the new total revenue the eliminations represent. The results indicate how much UnitedHealth’s operations are done just with itself. In 2023, that portion reached nearly 27%, a record for the company. Access the data here.
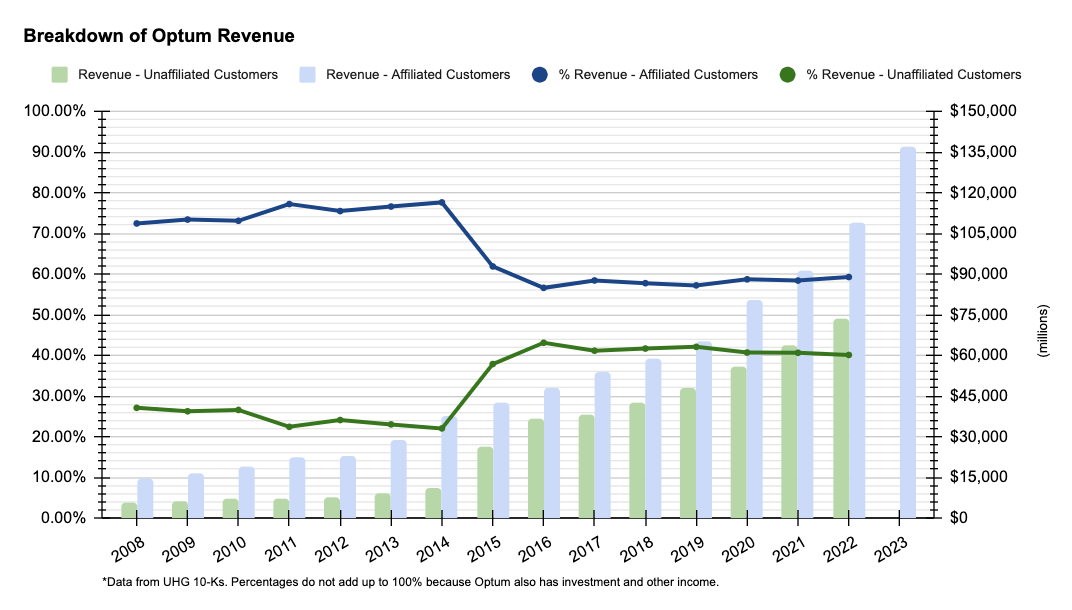
We couldn’t include every chart showcasing our findings in the article, so we’re eager to share some of them here. First up is a breakdown of Optum revenue from affiliated vs. unaffiliated customers. The chart shows that while affiliated customers make up the majority of Optum’s total revenue, external customers’ portion of that revenue has increased since 2008. That said, their portion has slightly declined since peaking in 2016 to about 40%. This could be happening for a number of reasons: UnitedHealthcare is steering more of its members to Optum doctors over others; Optum doctors are prioritizing UnitedHealthcare members over patients with other insurers, perhaps to help UnitedHealthcare avoid the Medical Loss Ratio; Optum is using UnitedHealthcare as a guaranteed customer to launch more analytics services, to name a few. (Note: We will update with 2023 data when UnitedHealth releases its 10-K.)
Secondly, we have a chart that compares UnitedHealth eliminations with its rivals. In 2022, both Cigna and CVS Health’s total eliminations as percent of pre-elimination revenue was not even half that of UnitedHealth’s. (Once Cigna and CVS release Q4 2023 financials, we will update the graphic here).
While it is hard to know the longterm impact of healthcare company’s shifting more and more business to its subsidiaries, it is not farfetched to think it creates a less competitive and less resilient system.
With only 3.7% of revenue coming from subsidiaries, the majority of Cigna’s patients get care from independent physicians and visit pharmacies that have no direct ties to Cigna’s bottom line. When these services are separate, there are no conflicts of interest between the insurer and the delivery of care.
When these services are connected, for instance, when a UnitedHealthcare patient sees an Optum doctor then gets a prescription filled through OptumRx, there are conflicts of interest that may sway the doctor’s decisions. By having payer-provider integration, an Optum doctor might be encouraged to perform certain procedures because it will cost less for the insurance arm, or might order a certain drug because OptumRx would take in a higher profit margin.
These are just some of the risks introduced when profit-seeking companies control both the delivery of care and the coverage/insurance side of the business.
You can find the calculations for all of our charts in our raw data linked above.


